> ## Documentation Index
> Fetch the complete documentation index at: https://docs.intellikon.ai/llms.txt
> Use this file to discover all available pages before exploring further.
# Monitor your prompts
> Check each prompt's health, get alerts when scores slip, look at individual AI requests and see what your prompts cost.
Once your prompts are in use, Nucleus shows you how they are doing. The **Dashboard** gives each active prompt a health score, **Health** raises alerts when scores start to slip, **Observability** lists individual AI requests, and **Analytics** adds up runs and cost. The **Dashboard** and **Health** work from evaluation scores, so they tell you most about the prompts you evaluate often.
## Before you start
Tenant Owners, Workspace Admins and Workspace Members can open the **Dashboard**, **Health** and **Observability**. **Analytics** is for Tenant Owners and Workspace Admins.
## Check prompt health
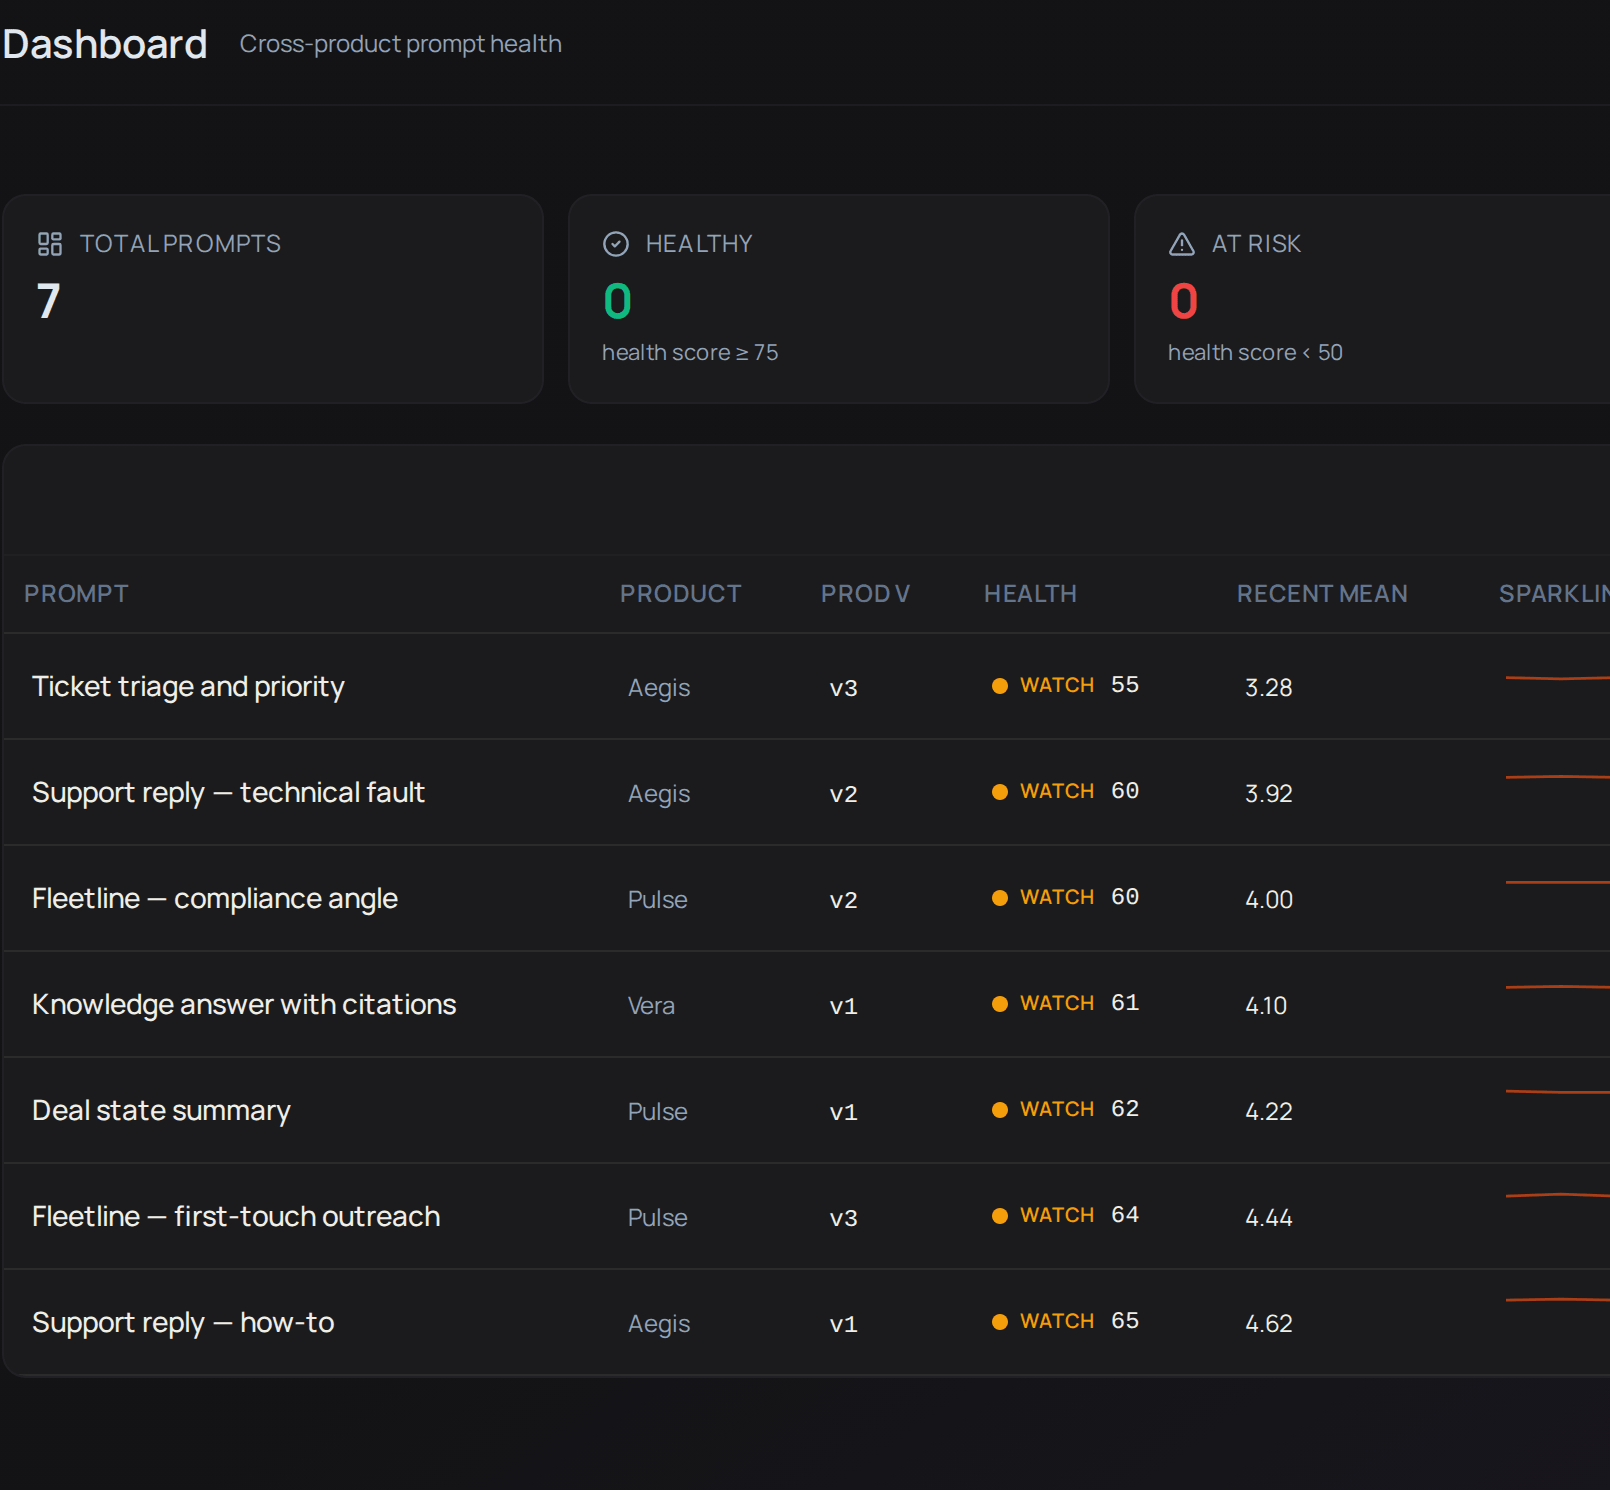 Select **Dashboard**. Each active prompt has a row showing its product, the version in production under **Prod v**, its **Health** score and a line of recent evaluation scores under **Sparkline**. **Decay** counts the prompt's open Health alerts.
The health score runs from 0 to 100. It takes account of the prompt's recent evaluation scores, whether they are rising or falling, and how recently it was evaluated. The tiles at the top count your prompts that are **Healthy**, at 75 or above, and **At risk**, below 50. Prompts in between show as **Watch**.
Use **Health: worst first** to change the order, and the product list to show one product. Next, [look at Health alerts](#get-alerts-when-scores-slip) for any prompt that needs attention.
## Get alerts when scores slip
Select **Dashboard**. Each active prompt has a row showing its product, the version in production under **Prod v**, its **Health** score and a line of recent evaluation scores under **Sparkline**. **Decay** counts the prompt's open Health alerts.
The health score runs from 0 to 100. It takes account of the prompt's recent evaluation scores, whether they are rising or falling, and how recently it was evaluated. The tiles at the top count your prompts that are **Healthy**, at 75 or above, and **At risk**, below 50. Prompts in between show as **Watch**.
Use **Health: worst first** to change the order, and the product list to show one product. Next, [look at Health alerts](#get-alerts-when-scores-slip) for any prompt that needs attention.
## Get alerts when scores slip
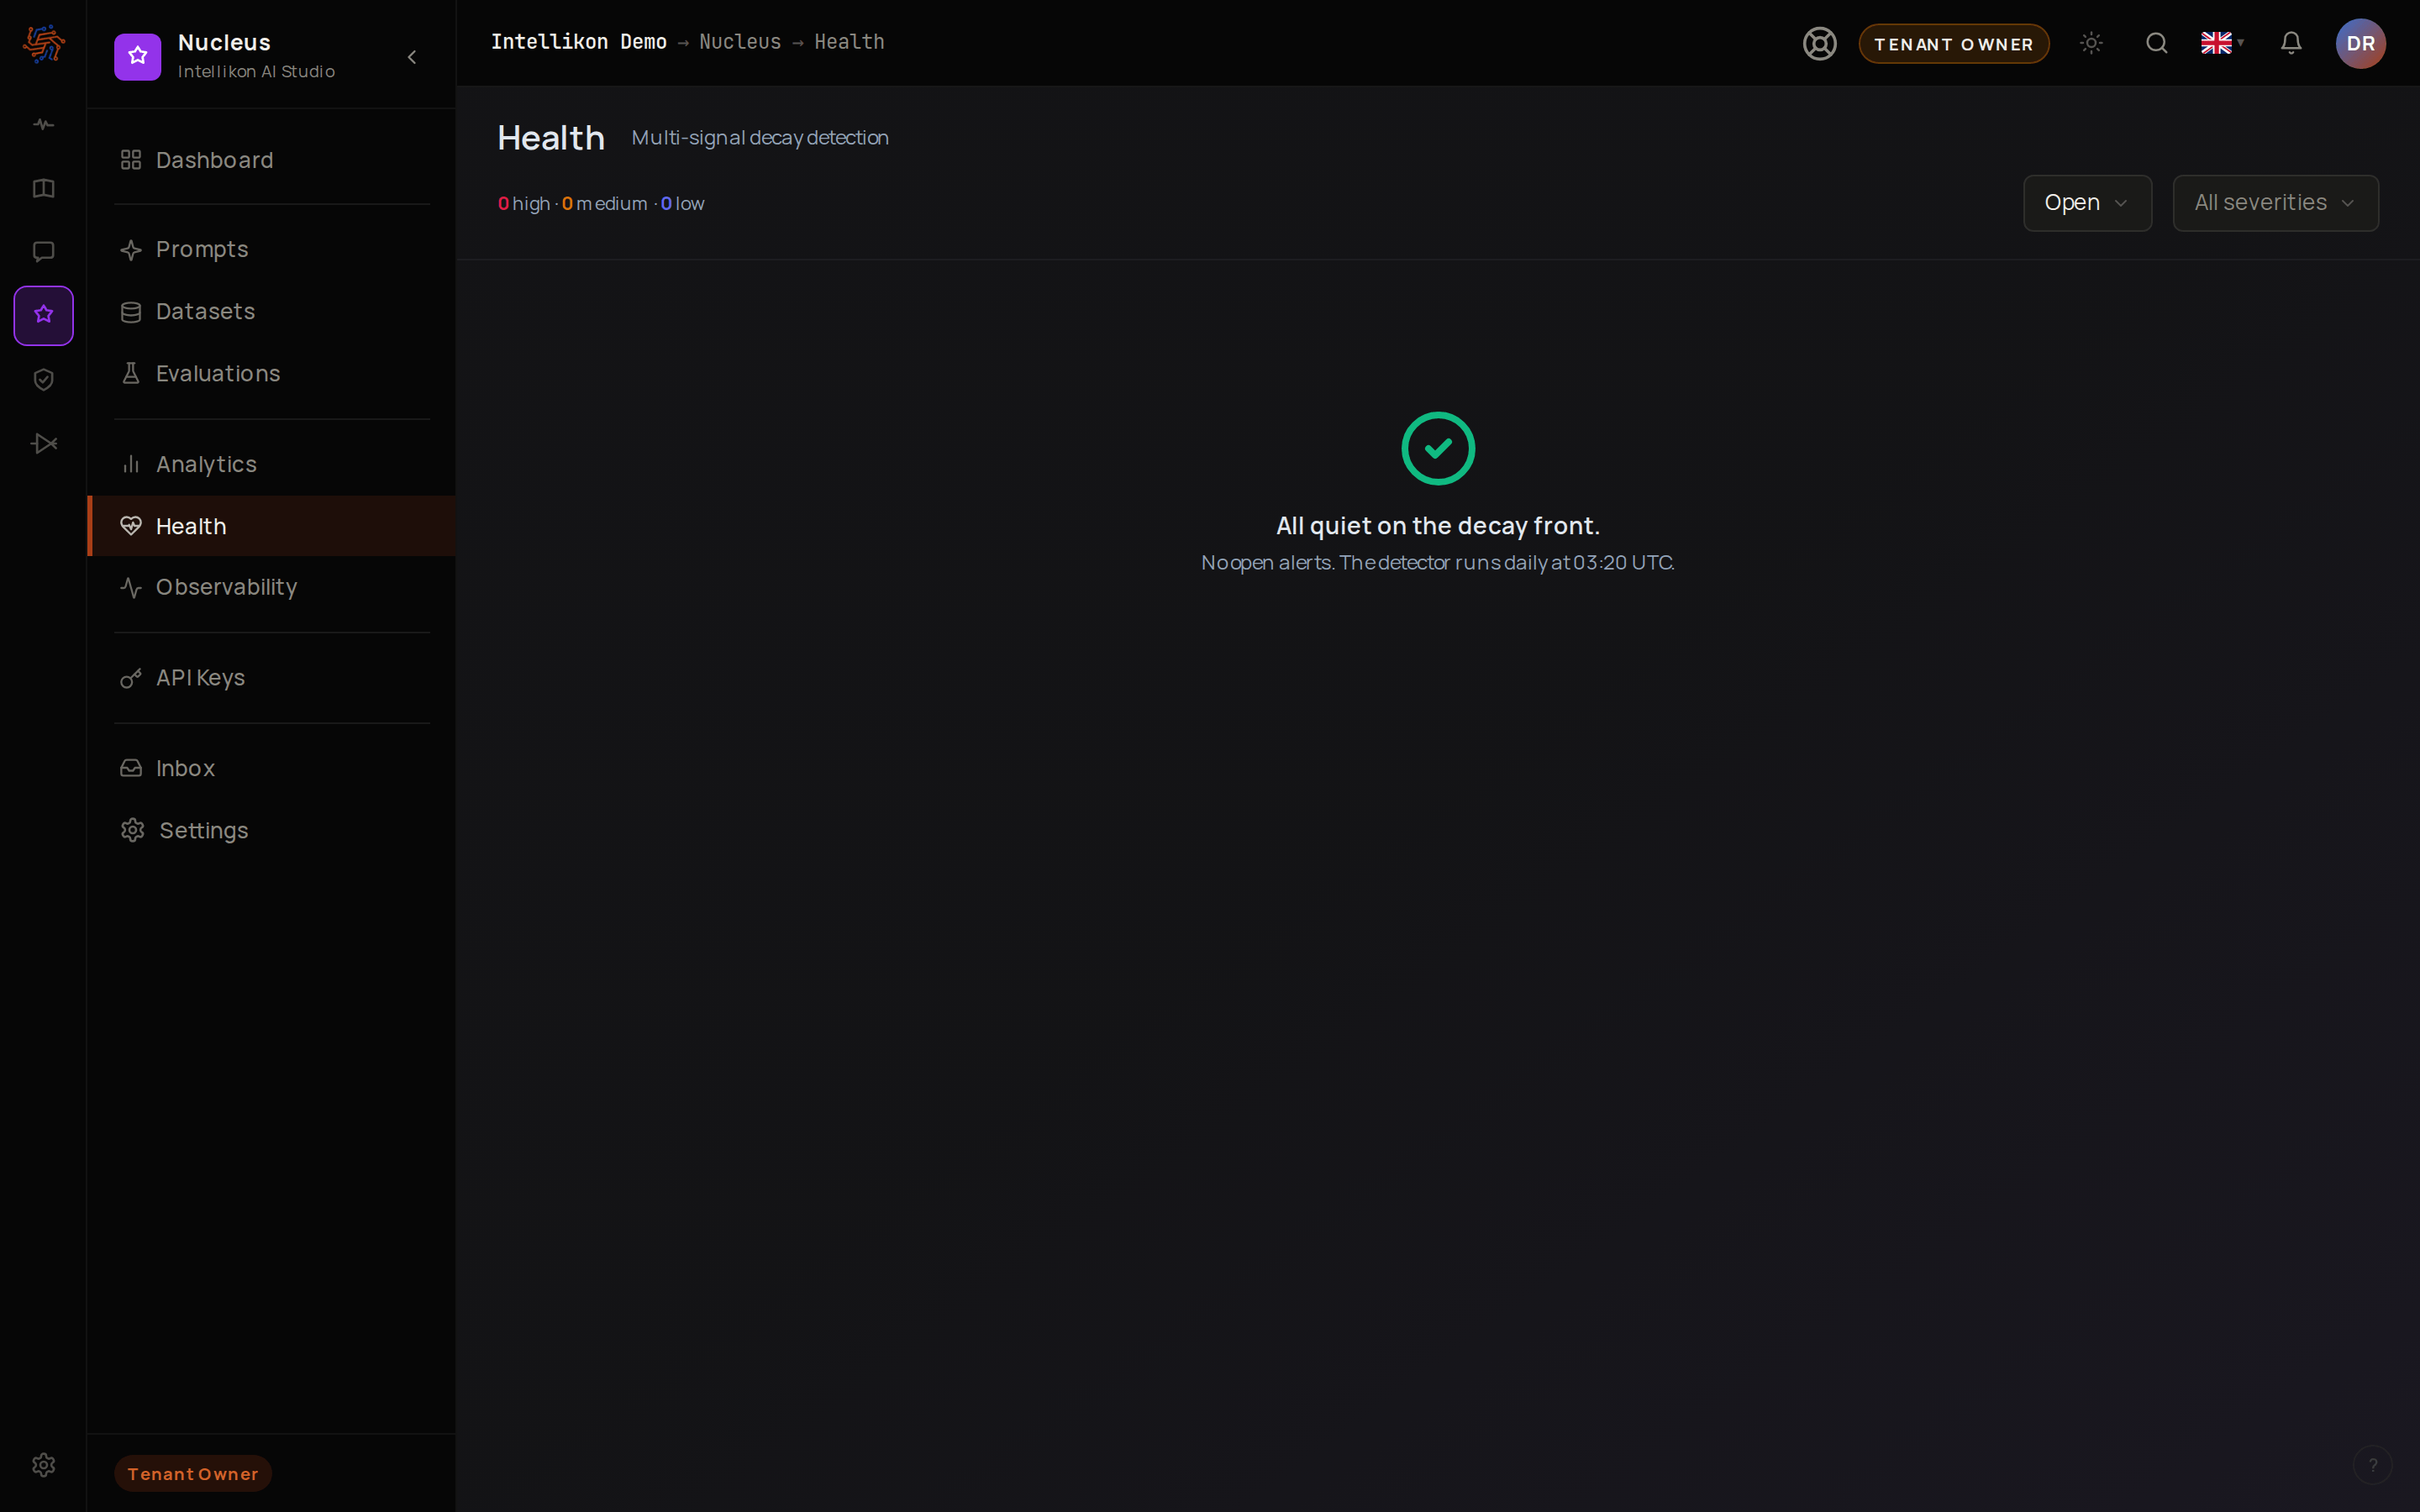 Nucleus checks your released versions once a day. When a version's recent scores drop, vary much more than before, or include some very low scores, it raises an alert on **Health**. Tenant Owners and Workspace Admins also get a notification in the Nucleus **Inbox**.
Select **Health** to see the alerts. Use the status list to show **Open**, **Acknowledged**, **Resolved** or **Dismissed** alerts, or **All**, and the severity list to show **High**, **Medium** or **Low**. With nothing to report, Health says "All quiet on the decay front."
Health can only spot a change once a version has been evaluated regularly. To make that happen, [turn on automatic evaluation](/products/nucleus/datasets-and-evaluations#evaluate-every-new-version-automatically). Next, [look at the requests behind a prompt](#look-at-individual-requests).
## Look at individual requests
Select **Observability** to see every request, or open a prompt and select **View requests** to see only that prompt's requests. To narrow the list, use **Select date range** and the prompt, product, model and source lists. Select **Clear filters** to start again. The tiles above the list add up the **Requests**, **Mean latency** and **Total cost** for what you are looking at. Select **Refresh** to have the list update itself every 30 seconds. The button then shows **Live**. Select it again to stop.
Select a row to open a request. It opens beside the list, with its time, the product that made it, the prompt, the model, how long it took, the tokens and cost, the input values and the answer. Next, [see what your prompts cost](#see-usage-and-cost).
## See usage and cost
Select **Analytics**. The page shows the last 30 days of runs made in Nucleus itself, from the playground and evaluations: **Total runs**, **Total tokens** and **Total cost**, then one row per prompt with its runs, tokens, cost and when it last ran. Select **Runs**, **Tokens**, **Cost** or **Last run** to sort by it. To see one product only, choose it in the list above the figures, which starts at **All products**.
Next, [check your notifications](#read-your-notifications).
## Read your notifications
Select **Inbox**, then **All notifications**. Health alerts arrive here for Tenant Owners and Workspace Admins.
Next, [improve the prompt that needs it](/products/nucleus/prompts#save-a-new-version).
## Troubleshooting
The Dashboard shows active prompts only. Open the prompt from **Prompts** and select **Activate** if it should be in use.
Widen the date range, or select **Clear filters**.
**Analytics** is for Tenant Owners and Workspace Admins. Ask one of them for the figures you need.
Nucleus checks your released versions once a day. When a version's recent scores drop, vary much more than before, or include some very low scores, it raises an alert on **Health**. Tenant Owners and Workspace Admins also get a notification in the Nucleus **Inbox**.
Select **Health** to see the alerts. Use the status list to show **Open**, **Acknowledged**, **Resolved** or **Dismissed** alerts, or **All**, and the severity list to show **High**, **Medium** or **Low**. With nothing to report, Health says "All quiet on the decay front."
Health can only spot a change once a version has been evaluated regularly. To make that happen, [turn on automatic evaluation](/products/nucleus/datasets-and-evaluations#evaluate-every-new-version-automatically). Next, [look at the requests behind a prompt](#look-at-individual-requests).
## Look at individual requests
Select **Observability** to see every request, or open a prompt and select **View requests** to see only that prompt's requests. To narrow the list, use **Select date range** and the prompt, product, model and source lists. Select **Clear filters** to start again. The tiles above the list add up the **Requests**, **Mean latency** and **Total cost** for what you are looking at. Select **Refresh** to have the list update itself every 30 seconds. The button then shows **Live**. Select it again to stop.
Select a row to open a request. It opens beside the list, with its time, the product that made it, the prompt, the model, how long it took, the tokens and cost, the input values and the answer. Next, [see what your prompts cost](#see-usage-and-cost).
## See usage and cost
Select **Analytics**. The page shows the last 30 days of runs made in Nucleus itself, from the playground and evaluations: **Total runs**, **Total tokens** and **Total cost**, then one row per prompt with its runs, tokens, cost and when it last ran. Select **Runs**, **Tokens**, **Cost** or **Last run** to sort by it. To see one product only, choose it in the list above the figures, which starts at **All products**.
Next, [check your notifications](#read-your-notifications).
## Read your notifications
Select **Inbox**, then **All notifications**. Health alerts arrive here for Tenant Owners and Workspace Admins.
Next, [improve the prompt that needs it](/products/nucleus/prompts#save-a-new-version).
## Troubleshooting
The Dashboard shows active prompts only. Open the prompt from **Prompts** and select **Activate** if it should be in use.
Widen the date range, or select **Clear filters**.
**Analytics** is for Tenant Owners and Workspace Admins. Ask one of them for the figures you need.