> ## Documentation Index
> Fetch the complete documentation index at: https://docs.intellikon.ai/llms.txt
> Use this file to discover all available pages before exploring further.
# Monitors
> Watch a number in your data and get an alert, or an Aegis ticket, when it crosses the line you set.
A monitor keeps an eye on one number in a data source, such as daily output or open tickets, and raises an alert when it crosses the line you set. The alert lands in the Prism Feed. You can also have the monitor raise a ticket in Aegis, so your team can pick it up there.
## Before you start
You need a [data source](/products/prism/data-sources). For a file or a database, Prism must first read its columns on the source's page, so the monitor can offer them. Built-in sources are ready straight away.
Tenant Owners, Workspace Admins and Workspace Members can create monitors. Only Tenant Owners and Workspace Admins can delete one.
## Choose what a monitor watches
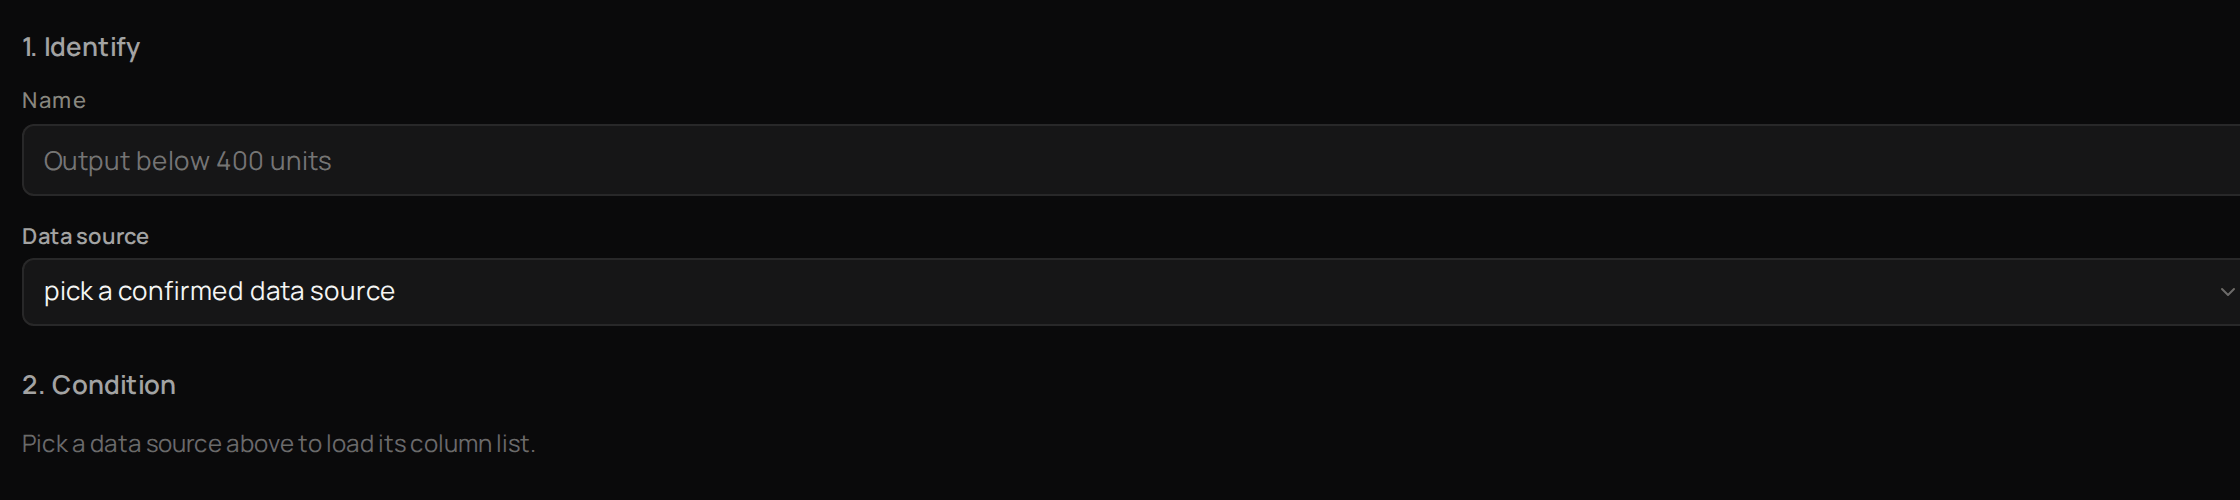 Select **Monitors**, then **New Monitor**.
Under **1. Identify**, give it a **Name** that says what it watches.
Choose the **Data source**.
Under **2. Condition**, choose what to watch.
Choose when the monitor should fire.
The form now shows the name, data source and condition you chose. Next, [choose what the monitor does](#choose-what-a-monitor-does).
## Choose what a monitor does
Select **Monitors**, then **New Monitor**.
Under **1. Identify**, give it a **Name** that says what it watches.
Choose the **Data source**.
Under **2. Condition**, choose what to watch.
Choose when the monitor should fire.
The form now shows the name, data source and condition you chose. Next, [choose what the monitor does](#choose-what-a-monitor-does).
## Choose what a monitor does
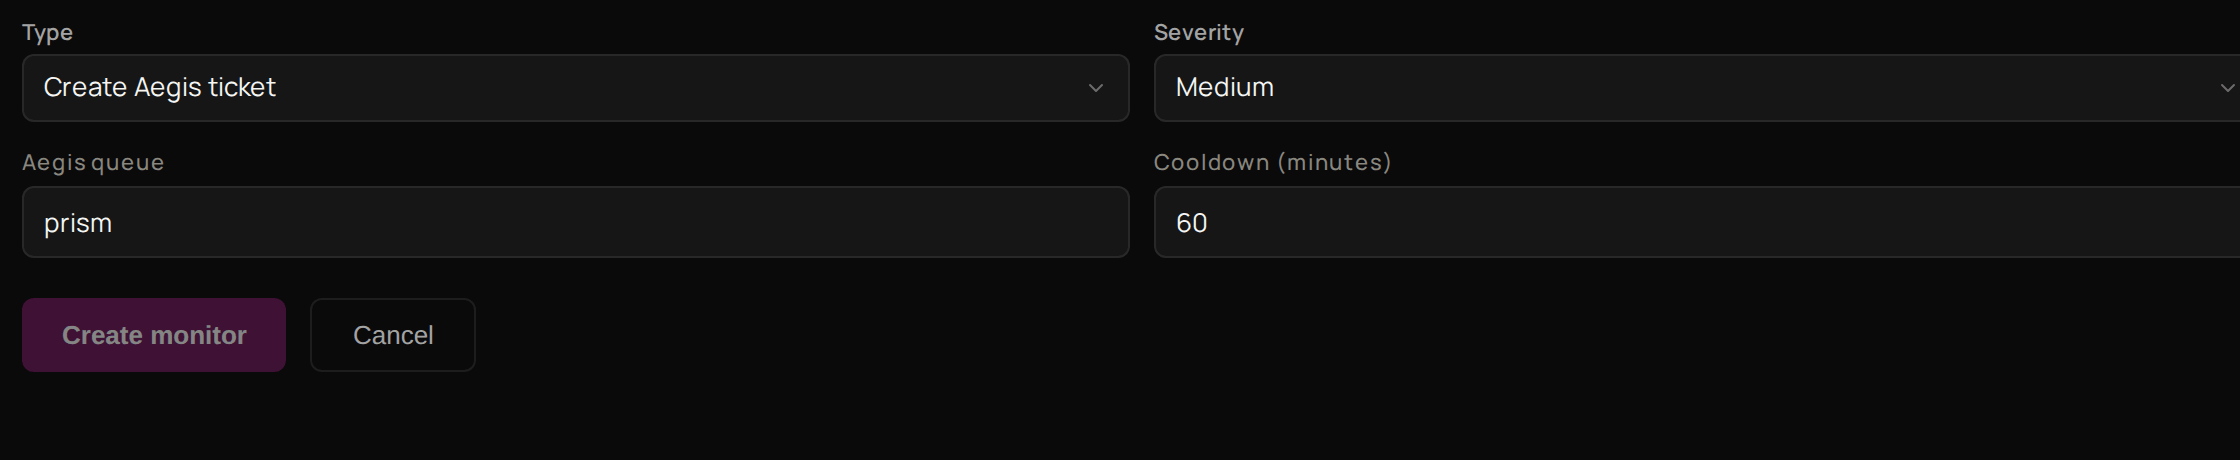 Carry on in the same form.
Under **3. Action**, choose the **Type**: **Create Aegis ticket** or **Notification only**.
Choose a **Severity**.
Under **Cooldown (minutes)**, enter how long the monitor waits after firing before it can fire again.
Select **Create monitor**.
The monitor opens and starts checking. When it fires, the alert shows in the [Feed](/products/prism/feed) under **Alerts**. With **Create Aegis ticket**, Prism also raises a ticket in Aegis at the same moment and the alert moves to **Done**. Next, [find your monitors](#find-a-monitor).
## Find a monitor
Select **Monitors**. Use **All states** to show only **Enabled** or **Paused** monitors, and **All data sources** to show the ones on one source. Next, [ask Prism a question](/products/prism/ask) about the same data.
## Troubleshooting
Prism has not read that source's columns yet. Open it from **Data Sources** and finish setting it up, then start the monitor again.
Give the monitor a **Name** and choose a **Data source**. Both are needed.
After it fires, a monitor waits for its **Cooldown (minutes)** before it can fire again.
Carry on in the same form.
Under **3. Action**, choose the **Type**: **Create Aegis ticket** or **Notification only**.
Choose a **Severity**.
Under **Cooldown (minutes)**, enter how long the monitor waits after firing before it can fire again.
Select **Create monitor**.
The monitor opens and starts checking. When it fires, the alert shows in the [Feed](/products/prism/feed) under **Alerts**. With **Create Aegis ticket**, Prism also raises a ticket in Aegis at the same moment and the alert moves to **Done**. Next, [find your monitors](#find-a-monitor).
## Find a monitor
Select **Monitors**. Use **All states** to show only **Enabled** or **Paused** monitors, and **All data sources** to show the ones on one source. Next, [ask Prism a question](/products/prism/ask) about the same data.
## Troubleshooting
Prism has not read that source's columns yet. Open it from **Data Sources** and finish setting it up, then start the monitor again.
Give the monitor a **Name** and choose a **Data source**. Both are needed.
After it fires, a monitor waits for its **Cooldown (minutes)** before it can fire again.