

 Pulse
Pulse Lexis
Lexis Vera
Vera Aegis
Aegis Prism
Prism Nucleus
Before you start
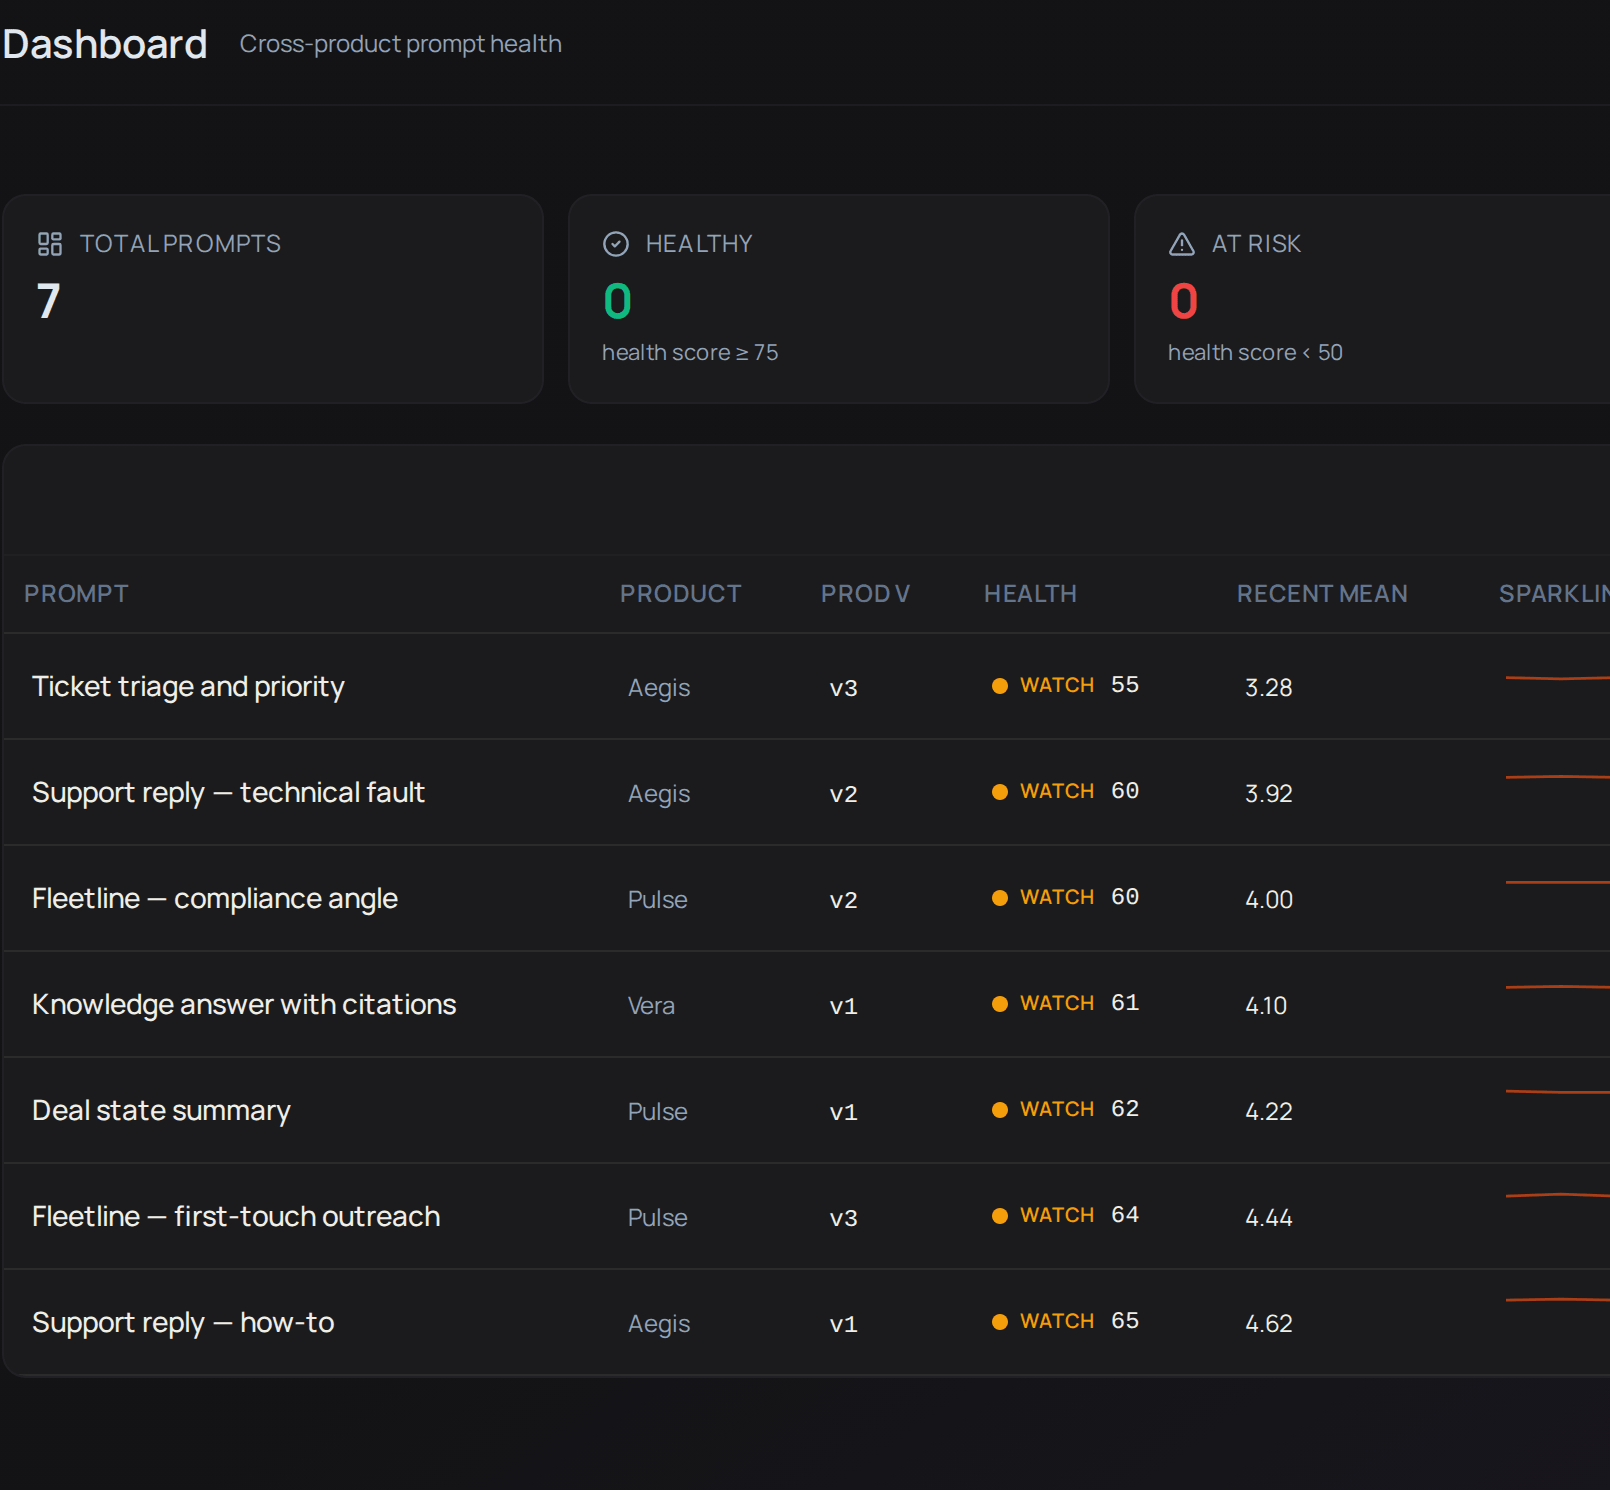
Tenant Owners, Workspace Admins and Workspace Members can open the Dashboard, Health and Observability. Analytics is for Tenant Owners and Workspace Admins.Check prompt health
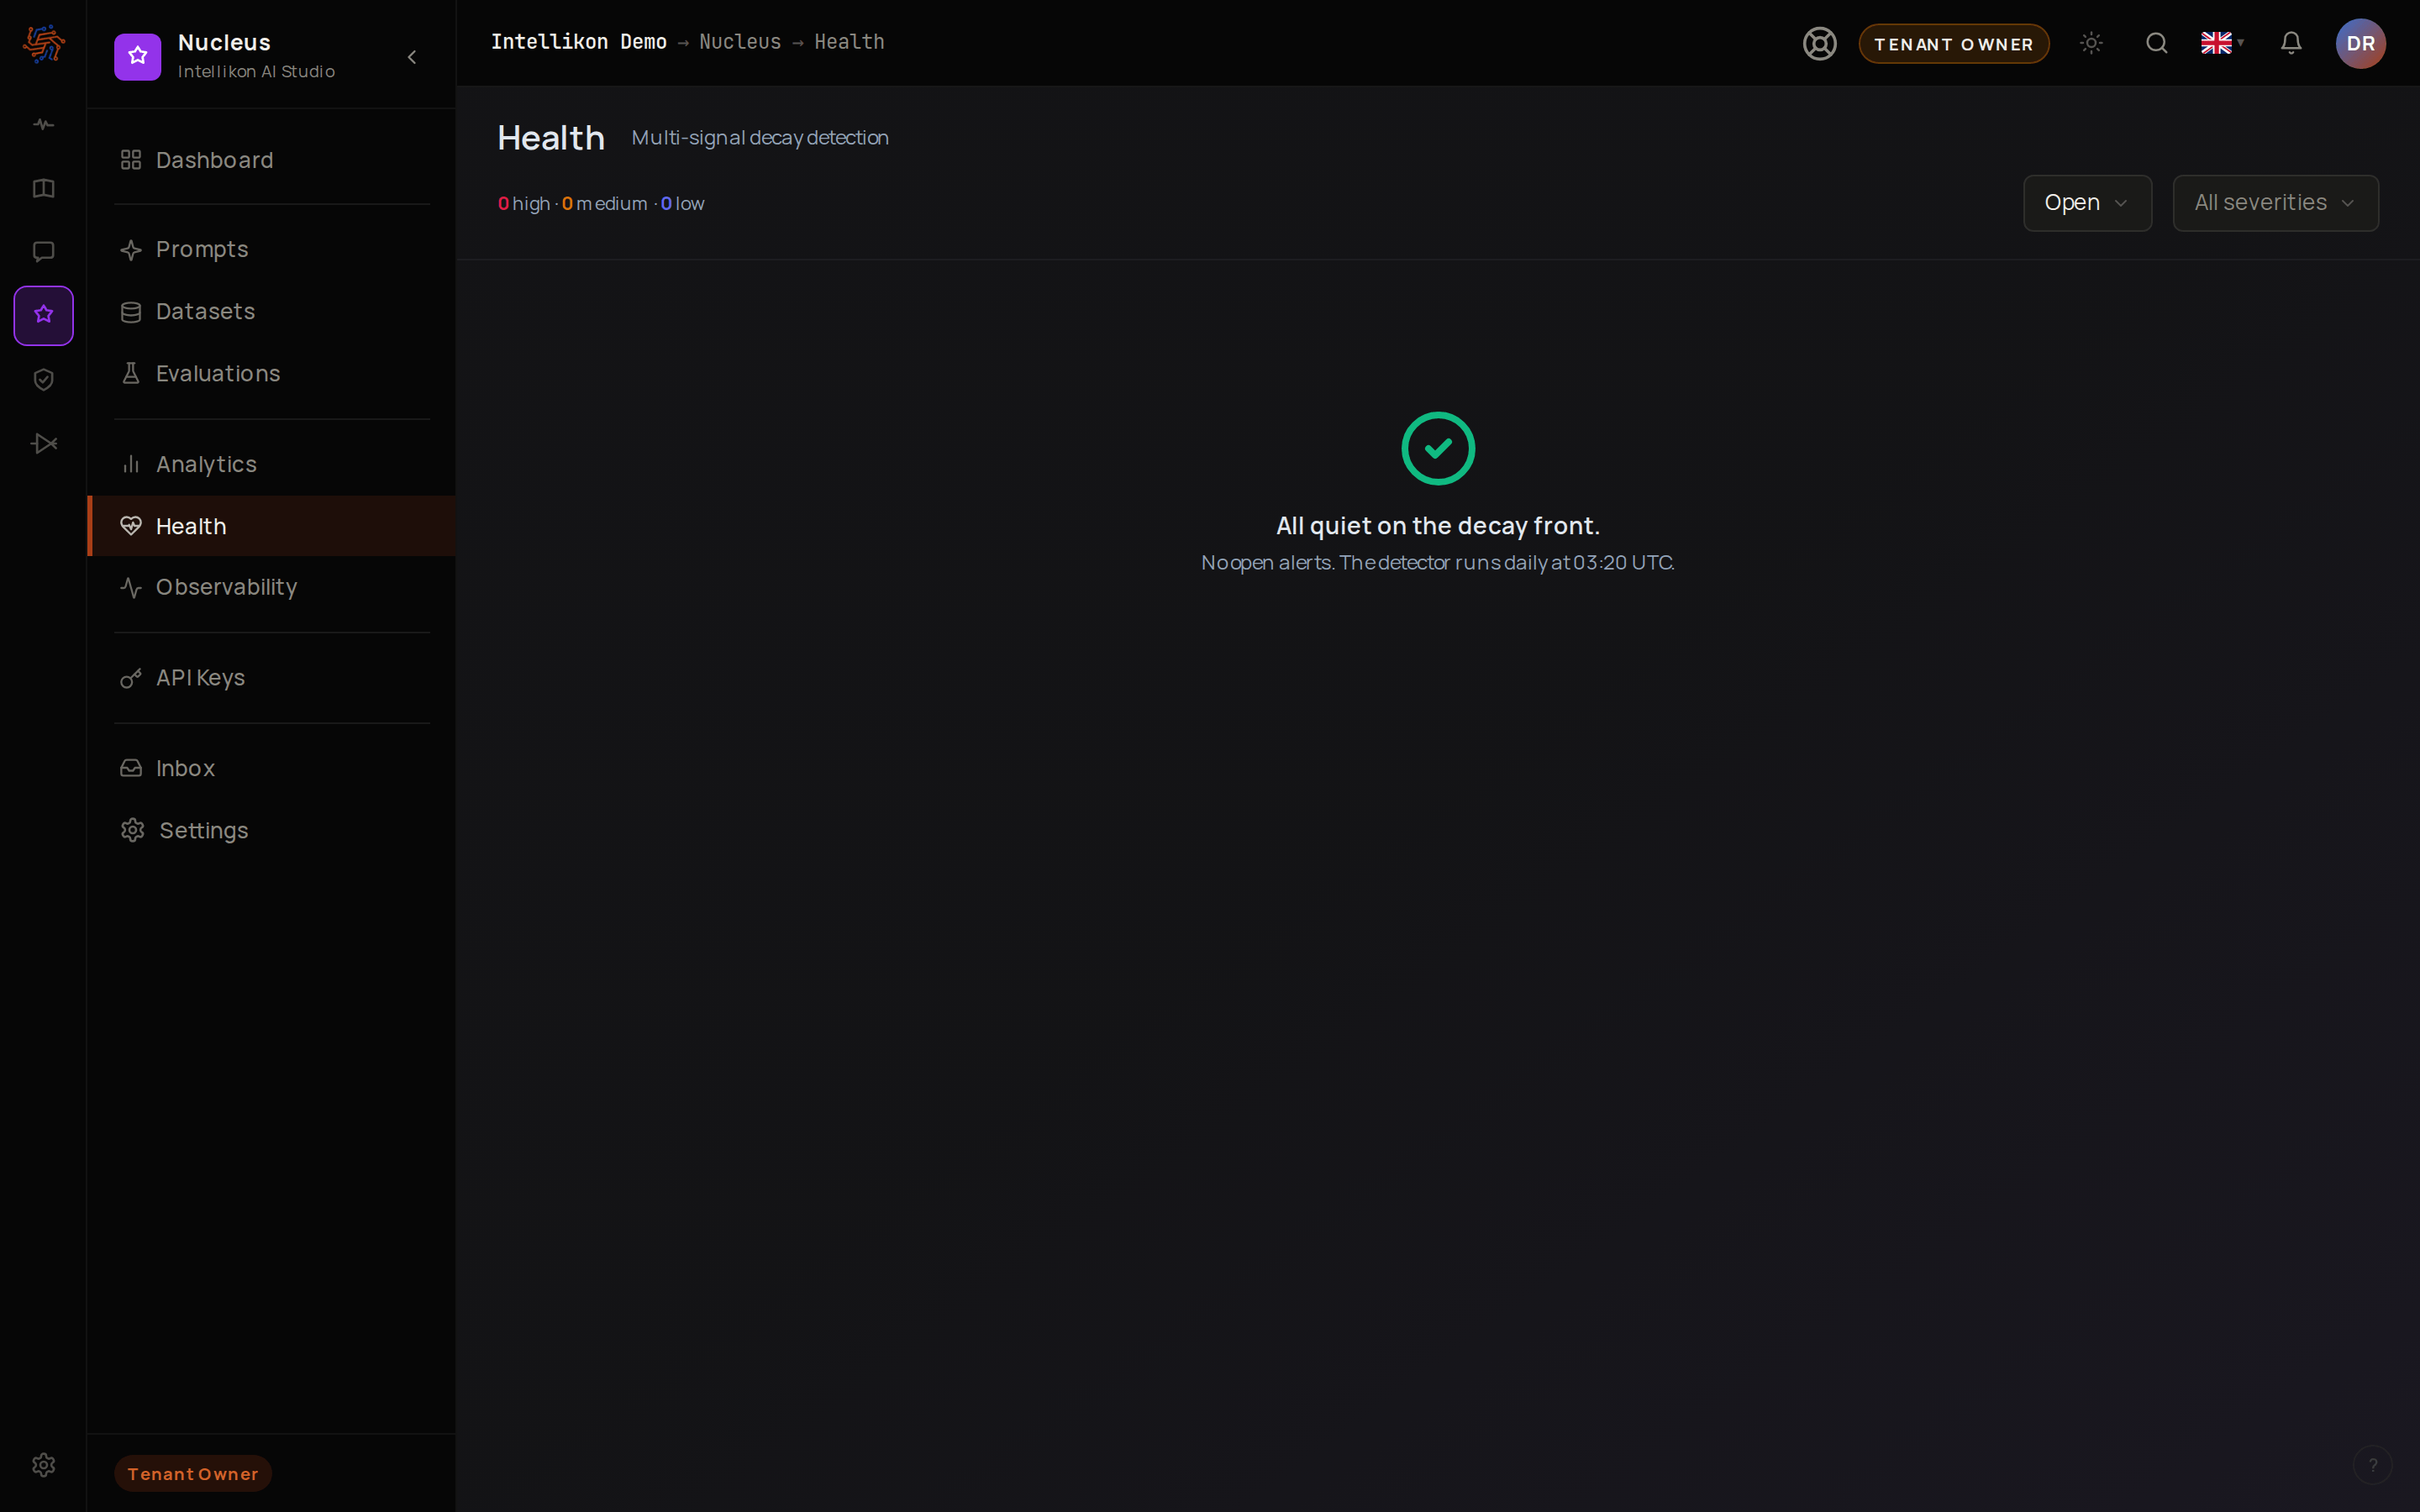
Get alerts when scores slip
Look at individual requests
Select Observability to see every request, or open a prompt and select View requests to see only that prompt’s requests. To narrow the list, use Select date range and the prompt, product, model and source lists. Select Clear filters to start again. The tiles above the list add up the Requests, Mean latency and Total cost for what you are looking at. Select Refresh to have the list update itself every 30 seconds. The button then shows Live. Select it again to stop. Select a row to open a request. It opens beside the list, with its time, the product that made it, the prompt, the model, how long it took, the tokens and cost, the input values and the answer. Next, see what your prompts cost.See usage and cost
Select Analytics. The page shows the last 30 days of runs made in Nucleus itself, from the playground and evaluations: Total runs, Total tokens and Total cost, then one row per prompt with its runs, tokens, cost and when it last ran. Select Runs, Tokens, Cost or Last run to sort by it. To see one product only, choose it in the list above the figures, which starts at All products. Next, check your notifications.Read your notifications
Select Inbox, then All notifications. Health alerts arrive here for Tenant Owners and Workspace Admins. Next, improve the prompt that needs it.Troubleshooting
A prompt is missing from the Dashboard
A prompt is missing from the Dashboard
The Dashboard shows active prompts only. Open the prompt from Prompts and select Activate if it should be in use.
Observability shows no requests
Observability shows no requests
Widen the date range, or select Clear filters.