

 Pulse
Pulse Lexis
Lexis Vera
Vera Aegis
Aegis Prism
Prism Nucleus
Before you start
You need a data source. For a file or a database, Prism must first read its columns on the source’s page, so the monitor can offer them. Built-in sources are ready straight away. Tenant Owners, Workspace Admins and Workspace Members can create monitors. Only Tenant Owners and Workspace Admins can delete one.Choose what a monitor watches
1
Start
Select Monitors, then New Monitor.
2
Name it
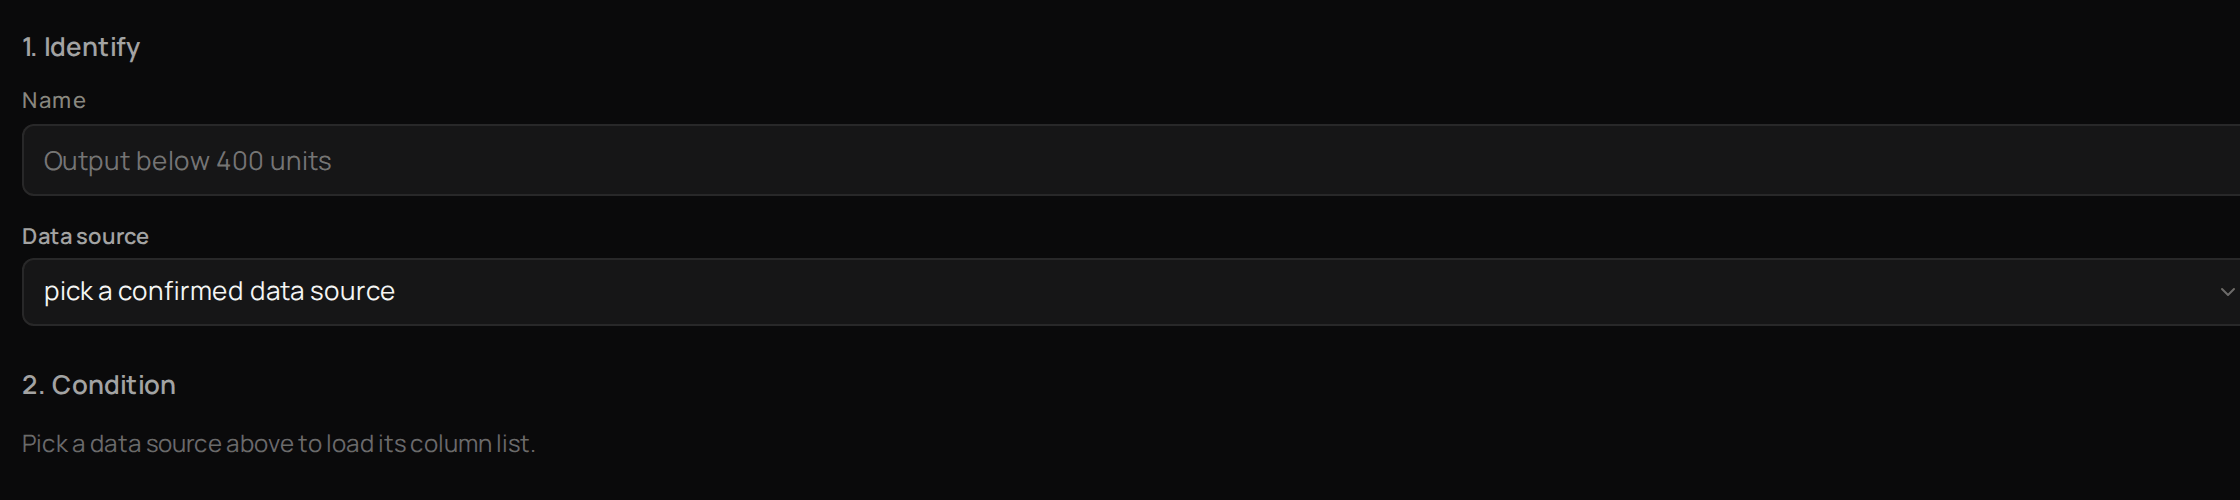
Under 1. Identify, give it a Name that says what it watches.
3
Choose the data
Choose the Data source.
4
Choose what to watch
Under 2. Condition, choose what to watch.
5
Set when it fires
Choose when the monitor should fire.
Choose what a monitor does
1
Choose what happens
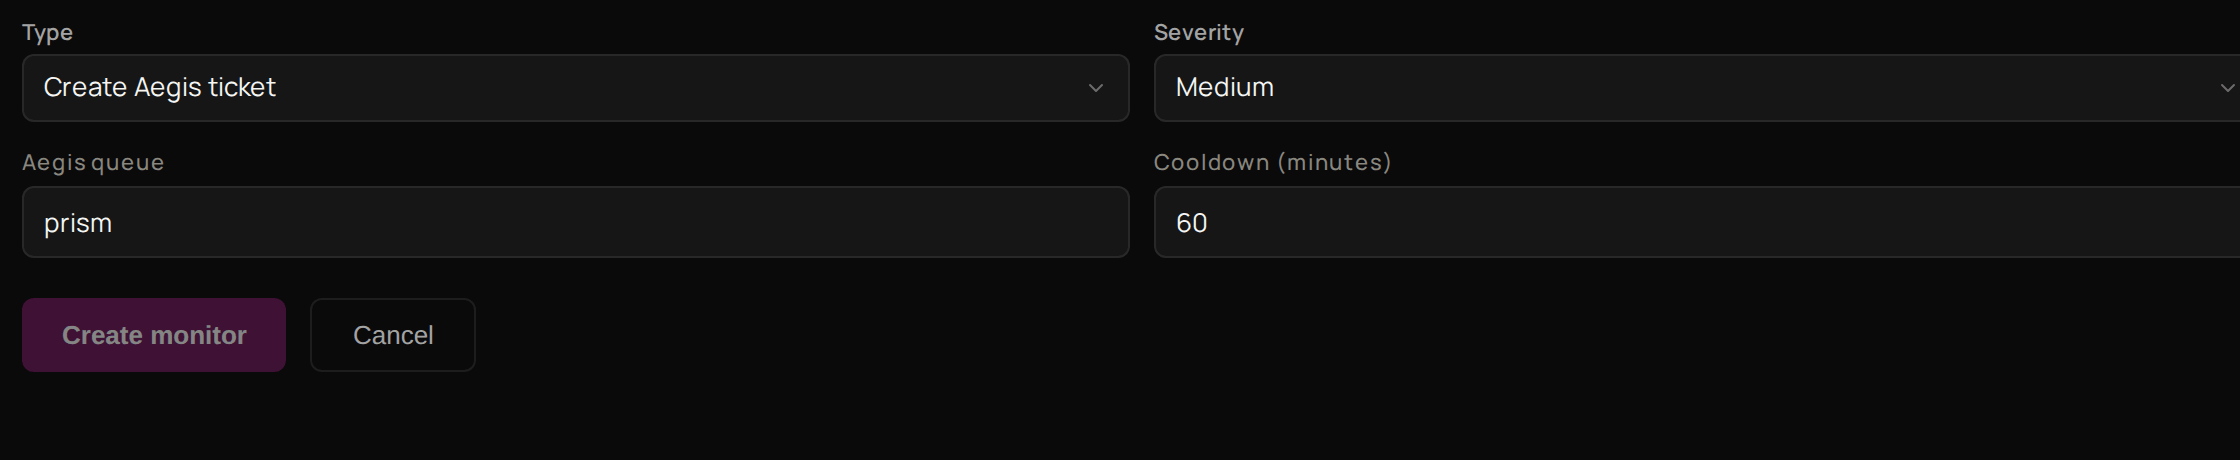
Under 3. Action, choose the Type: Create Aegis ticket or Notification only.
2
Set the severity
Choose a Severity.
3
Set a pause between alerts
Under Cooldown (minutes), enter how long the monitor waits after firing before it can fire again.
4
Create it
Select Create monitor.
Find a monitor
Select Monitors. Use All states to show only Enabled or Paused monitors, and All data sources to show the ones on one source. Next, ask Prism a question about the same data.Troubleshooting
2. Condition still asks you to pick a data source
2. Condition still asks you to pick a data source
Prism has not read that source’s columns yet. Open it from Data Sources and finish setting it up, then start the monitor again.
Create monitor stays greyed out
Create monitor stays greyed out
Give the monitor a Name and choose a Data source. Both are needed.
The monitor fired once and then went quiet
The monitor fired once and then went quiet
After it fires, a monitor waits for its Cooldown (minutes) before it can fire again.