

 Pulse
Pulse Lexis
Lexis Vera
Vera Aegis
Aegis Prism
Prism Nucleus
Before you start
Tenant Owners, Workspace Admins and Workspace Members can see all three. Only Tenant Owners and Workspace Admins see Recommendations on the dashboard.Read the dashboard
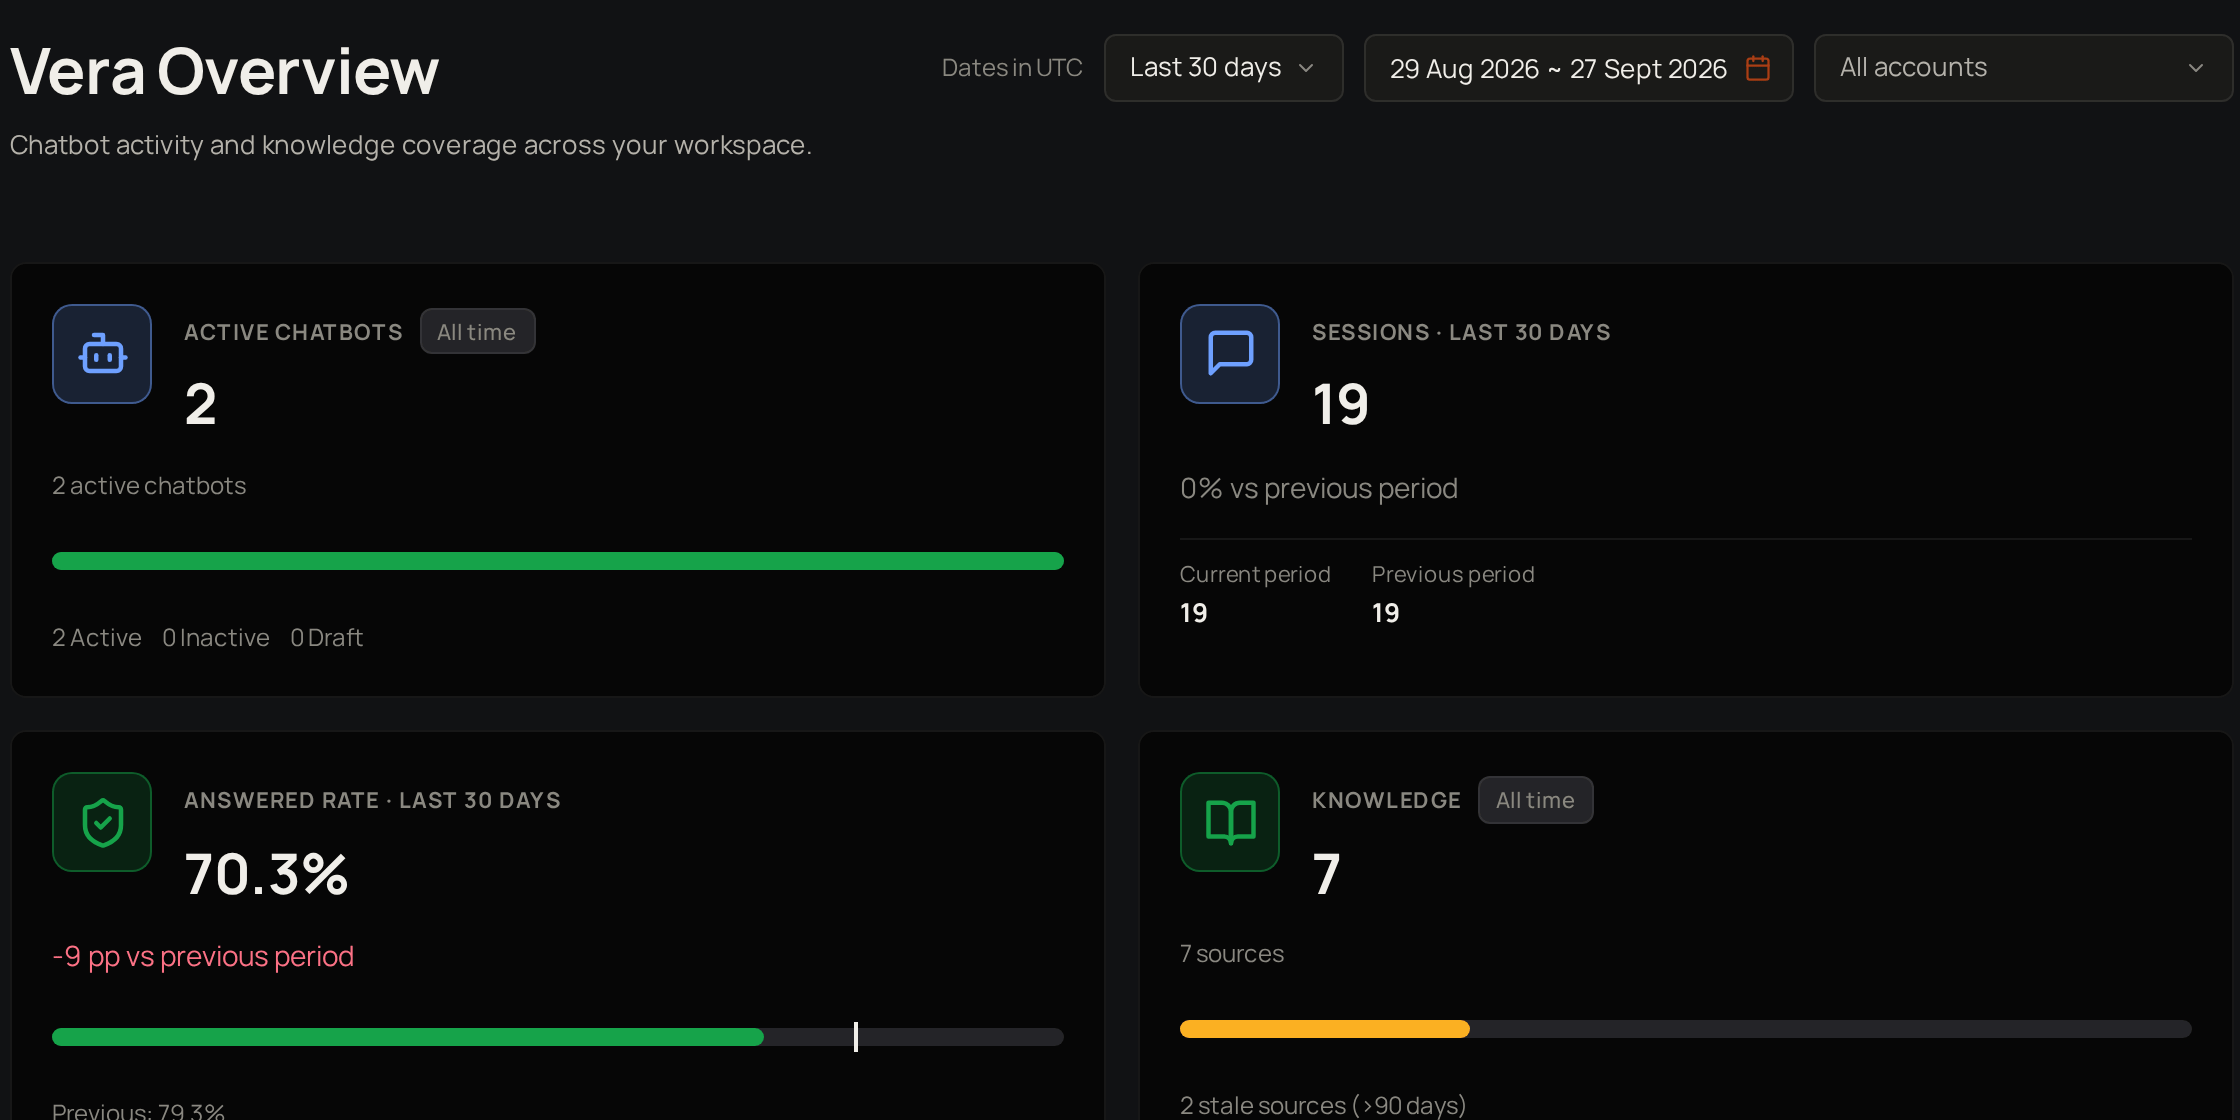
Below the figures, Top unanswered questions lists the questions asked most often in the last 90 days that your chatbots could not answer. Knowledge freshness shows how many sources are ready, stale, waiting, being read or failed.
Recommendations suggests what to fix, such as stale sources or questions that keep going unanswered. Rate a recommendation with Helpful or Not helpful, or select Dismiss to remove it. Next, compare your chatbots.
Compare your chatbots
Select Analytics. Choose an account under Account, if you want, to narrow the totals and the trend to that account. The figures show your chatbots, sessions, messages and any sources that failed to load in the period. Chatbot Activity lists each chatbot’s sessions and messages, and Top user languages shows the languages people wrote in. Select Chart interval to change how a chart groups the dates, such as Daily or Weekly. Next, look closely at one chatbot.Look closely at one chatbot
Select Analytics, then open Chatbot deep-dive at the top and choose a chatbot. Check Sessions, User messages, Avg. per session and Fallback rate. The fallback rate is the share of questions it could not answer. Read Top questions for what people ask most, and Unanswered questions for what it could not answer. Select Overview at the top to go back to all chatbots. Next, work through the unanswered questions.Review unanswered questions
On a chatbot’s deep-dive, Unanswered questions lists each question the chatbot could not answer, with how many times it was asked. Use Search questions and Review status to find one. When you have dealt with a question, for example by adding a source or a curated answer, select Mark reviewed, the tick next to it. The question now shows as Reviewed, with the date under Last reviewed. Next, see activity by account.The weekly email
Each Monday, if a chatbot had questions it could not answer in the past seven days, Vera emails a Tenant Owner of the workspace, or a Workspace Admin if there is no Tenant Owner. The email names the chatbot, gives the number of unanswered questions and lists up to five of the most common ones.See activity by account
Select Accounts. The list shows each customer account linked to your workspace, with its industry, domain, the date it was added and how many sessions came from it. Search or sort the list to find one. Accounts are view only in Vera. Select Manage in Settings → to open Accounts in Studio settings. Tenant Owners and Workspace Admins can add and change accounts there. Next, go back to the Vera overview.Troubleshooting
Top unanswered questions is empty
Top unanswered questions is empty
No chatbot has had a question it could not answer in the last 90 days, or no one has chatted with them yet.
You do not see Recommendations
You do not see Recommendations
Only Tenant Owners and Workspace Admins see them.
A chart does not offer Weekly or Monthly
A chart does not offer Weekly or Monthly
Weekly needs a period of at least 14 days, and Monthly at least 60. Choose a longer period at the top to see more options.